ScratchBest Research · Published September 9, 2026
Do More Expensive Scratch-Off Tickets Have Higher Expected Value?
Ticket price had positive rank associations with both Starting ROI and Current EV across 813 active games, but this cross-sectional result is not causal or a buying strategy.
The bottom line
What the data supports
The pooled Spearman correlation was 0.776 for ticket price versus Starting ROI and 0.733 for ticket price versus Current EV.
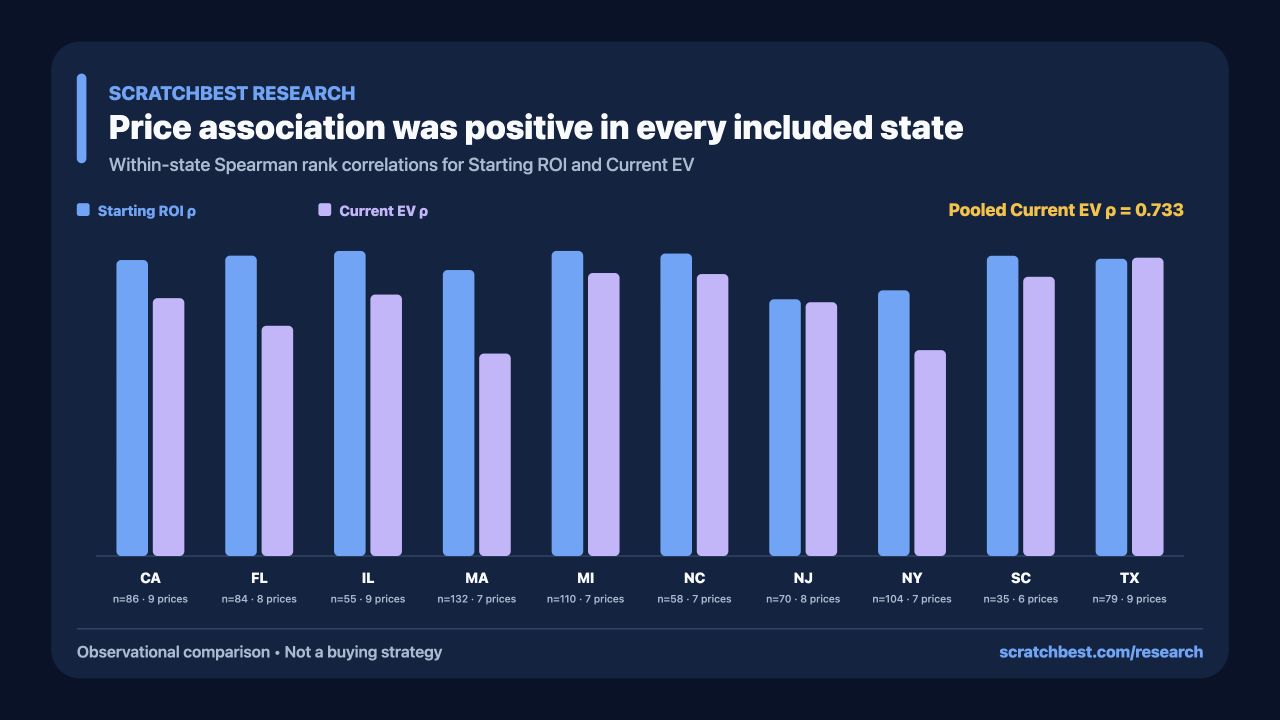
Both associations were positive in every included state; Current EV correlations ranged from 0.649 in Massachusetts to 0.956 in Texas.
After removing within-price-group outliers, pooled correlations were 0.834 for Starting ROI and 0.796 for Current EV.
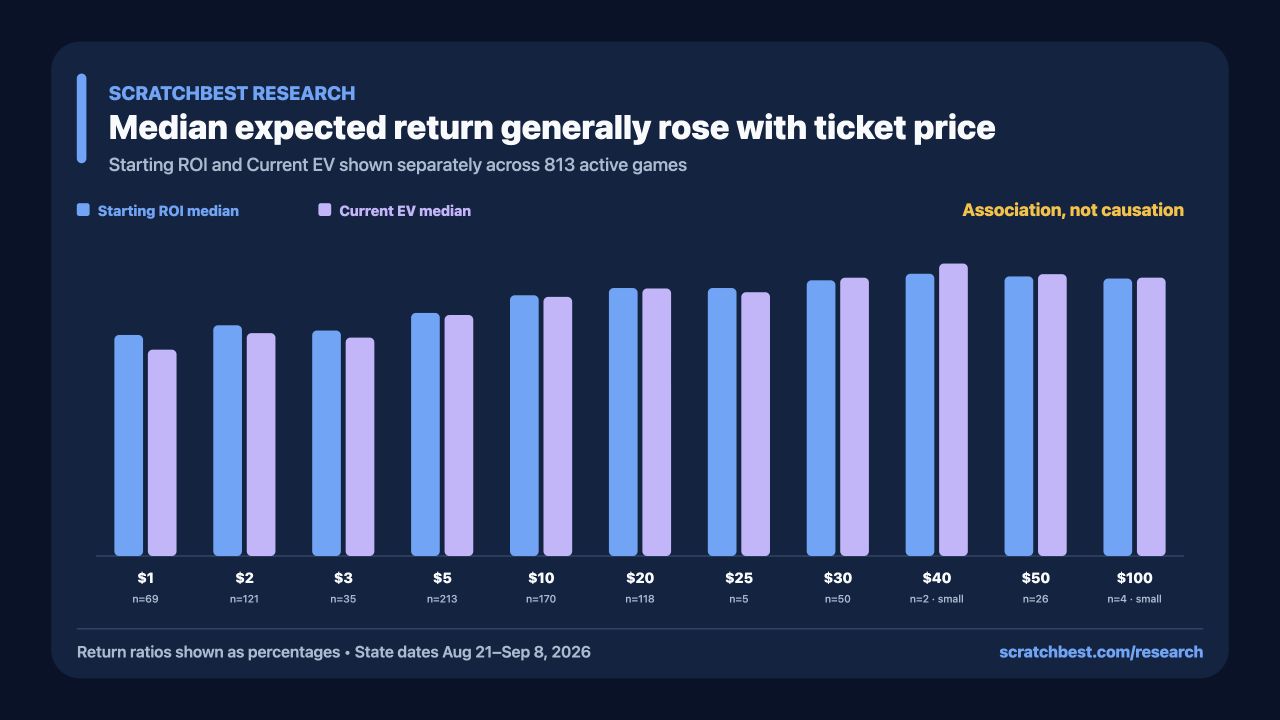
Medians generally rose through the main price groups, while the $30 Current EV mean was pulled upward by extreme observations.
Visual results
Charts with exact values
Each chart is rendered accessibly below and has a 1600×900 PNG download for social posts or presentations.
Median expected return by ticket price
Starting ROI and Current EV remain separate; values are return ratios shown as percentages.
Price association remained positive within every state
Spearman ρ by state. Positive values mean higher prices tended to rank with higher metric values.
Detailed results
The numbers behind the charts
| Price | n | Mean | Median | SD | P25 | P75 | Min | Max | Outliers |
|---|---|---|---|---|---|---|---|---|---|
| $1 | 69 | 64.4% | 63.8% | 3.5% | 62.0% | 66.3% | 60.0% | 70.0% | 0 |
| $2 | 121 | 67.3% | 66.6% | 3.6% | 64.2% | 69.6% | 60.4% | 73.2% | 0 |
| $3 | 35 | 65.9% | 65.0% | 2.5% | 63.2% | 68.9% | 63.0% | 69.6% | 0 |
| $5 | 213 | 70.6% | 70.1% | 4.0% | 68.2% | 72.1% | 52.5% | 79.5% | 20 |
| $10 | 170 | 75.6% | 75.2% | 4.9% | 72.9% | 77.0% | 61.9% | 87.6% | 27 |
| $20 | 118 | 76.9% | 77.3% | 3.5% | 75.0% | 78.4% | 66.8% | 85.7% | 13 |
| $25 | 5 | 76.5% | 77.3% | 3.7% | 75.2% | 77.7% | 71.1% | 81.1% | 1 |
| $30 | 50 | 78.7% | 79.5% | 3.0% | 76.1% | 80.1% | 73.3% | 84.5% | 0 |
| $40small | 2 | 81.4% | 81.4% | 1.6% | 80.9% | 82.0% | 80.3% | 82.5% | Not assessed |
| $50 | 26 | 80.3% | 80.6% | 2.0% | 78.1% | 81.6% | 77.9% | 84.0% | 0 |
| $100small | 4 | 80.0% | 80.0% | 0.1% | 80.0% | 80.1% | 80.0% | 80.1% | 0 |
| Price | n | Mean | Median | SD | P25 | P75 | Min | Max | Outliers |
|---|---|---|---|---|---|---|---|---|---|
| $1 | 69 | 59.5% | 59.5% | 5.3% | 57.3% | 63.0% | 46.0% | 69.6% | 1 |
| $2 | 121 | 64.9% | 64.3% | 7.7% | 62.0% | 67.0% | 36.0% | 106.7% | 10 |
| $3 | 35 | 62.7% | 63.0% | 4.8% | 61.0% | 65.5% | 47.3% | 69.2% | 3 |
| $5 | 213 | 69.8% | 69.5% | 11.5% | 66.0% | 71.8% | 49.0% | 182.3% | 22 |
| $10 | 170 | 76.3% | 74.8% | 15.0% | 70.1% | 77.6% | 46.0% | 207.1% | 13 |
| $20 | 118 | 77.7% | 77.2% | 7.4% | 74.3% | 79.5% | 57.0% | 120.8% | 15 |
| $25 | 5 | 74.4% | 76.1% | 3.4% | 70.9% | 76.6% | 70.8% | 77.9% | 0 |
| $30 | 50 | 86.9% | 80.0% | 53.9% | 77.0% | 82.1% | 62.0% | 458.4% | 4 |
| $40small | 2 | 84.4% | 84.4% | 1.4% | 83.9% | 84.8% | 83.4% | 85.3% | Not assessed |
| $50 | 26 | 84.6% | 81.3% | 11.5% | 79.1% | 82.8% | 77.8% | 123.4% | 4 |
| $100small | 4 | 80.2% | 80.3% | 0.3% | 80.1% | 80.3% | 79.7% | 80.4% | 1 |
| State | n | Prices | Starting ROI ρ | Current EV ρ |
|---|---|---|---|---|
| CA | 86 | 9 | 0.949 | 0.826 |
| FL | 84 | 8 | 0.963 | 0.738 |
| IL | 55 | 9 | 0.978 | 0.838 |
| MA | 132 | 7 | 0.917 | 0.649 |
| MI | 110 | 7 | 0.978 | 0.907 |
| NC | 58 | 7 | 0.969 | 0.904 |
| NJ | 70 | 8 | 0.823 | 0.813 |
| NY | 104 | 7 | 0.863 | 0.659 |
| SC | 35 | 6 | 0.962 | 0.895 |
| TX | 79 | 9 | 0.953 | 0.956 |
Sensitivity after removing within-price-group Tukey outliers: Starting ROI ρ=0.834 (61 observations removed); Current EV ρ=0.796 (73 removed).
Download aggregate CSVMethodology
- 1The sample used each state’s latest available snapshot and the production active-game rule. All 813 active games had a positive ticket price, Starting ROI, and Current EV.
- 2Starting ROI and Current EV were analyzed separately in native return-ratio units: 0.80 means an 80% expected return per dollar, not an 80% chance of winning.
- 3Price groups used the actual prices in the data. Descriptives use sample standard deviation and type-7 interpolated quartiles.
- 4Spearman rank correlation with average ranks for ties was calculated pooled and within each state. This measures association, not causation.
- 5A sensitivity analysis removed metric observations flagged by a within-price-group Tukey 1.5-IQR rule.
Exclusions
No active games were excluded: all 813 had valid price, Starting ROI, and Current EV values, with no duplicate active identities.
Limits to keep in mind
- The cross-sectional design cannot establish that price causes expected value to change.
- State game mix can confound pooled results; within-state correlations provide context but do not remove all confounding.
- Current EV is a ScratchBest calculation based on reported prize counts and estimated remaining inventory, not an official lottery metric.
- The $40 and $100 groups are very small, and several price groups contain outliers. Means should be read alongside medians.
- State snapshots are dated differently, and the results do not represent retailer inventory or realized returns.
State snapshot coverage
Each state is analyzed at its own latest available date. The sample is not one simultaneous national snapshot.
NY
2026-09-08
104 active games
FL
2026-09-02
84 active games
CA
2026-09-06
86 active games
MI
2026-09-08
110 active games
MA
2026-09-08
132 active games
NC
2026-09-07
58 active games
TX
2026-09-07
79 active games
IL
2026-08-21
55 active games
NJ
2026-09-08
70 active games
SC
2026-09-08
35 active games
Share responsibly
Suggested post copy
Disclosure: I run ScratchBest. In 813 active games across 10 dated state snapshots, ticket price had positive rank associations with Starting ROI (ρ=.776) and Current EV (ρ=.733), and both stayed positive within every state. This is association—not causation or a buying strategy. Full methods: https://www.scratchbest.com/research/ticket-price-and-scratch-off-expected-value
Before posting, check the specific community’s rules and disclose your connection to ScratchBest. Avoid repetitive cross-posting or presenting these results as advice about what to buy.